Prerequisites
XPS setting PERMON (on page 1)
Performance Counters display the count of different XPS entities, such as containers, work instructions, and work assignments. When XPS slows down or hangs, you can check the memory usage of each entity by viewing the count of that entity, determine the bottlenecks, and decide upon remedial action. To facilitate capturing the count of the XPS entities, live data is captured from the XPS memory cache and is updated in the Windows Registry.
This functionality is available only when you set the XPS setting PERMON to a non-zero value. PERMON determines the frequency of updates to the Windows Registry. If you set PERMON to 1, XPS updates live data to the Windows Registry every one minute. Subsequent updates to the registry are done only when there are updates to the entities in XPS.
You can view the XPS performance counters using one of the following monitoring tools:
Windows Performance Monitor
Zabbix monitoring tool to represent the data graphically
Zabbix is not supported under Navis' standard Maintenance and Support program. Contact Navis Technical Services to assist with issues encountered when using Zabbix for monitoring purposes.
All the XPS performance counters in both Windows Performance Monitor and Zabbix start with the prefix ‘XPS <xxxxx>', such as ‘XPS.containers’, ‘XPS.work.instructions', and ‘XPS.work.assignments’.
View XPS performance counters using Windows Performance Monitor
To view the XPS performance counters using Windows Performance Monitor:
Log into XPS as Administrator.
Open Windows Performance Monitor.
Select Performance Monitor on the left pane (Performance>Monitoring Tools>Performance Monitor) to open the monitoring screen.
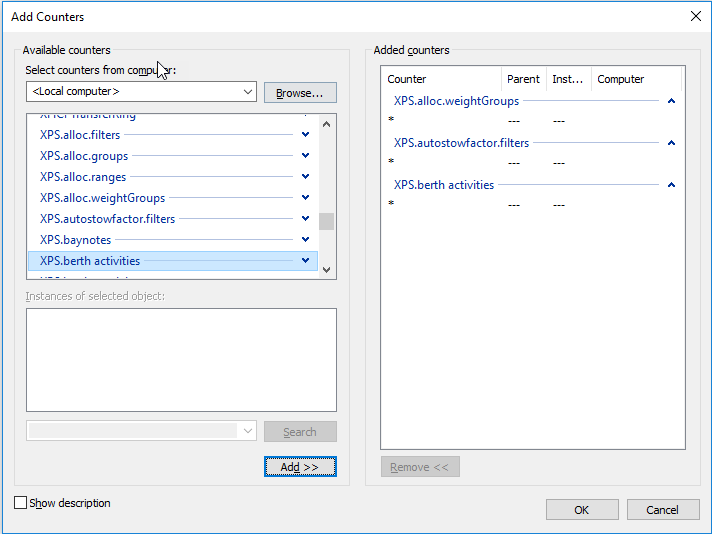
Click the Plus button on the top in the monitoring screen to open the Add Counters window.
Select the required XPS performance counter from the list of counters. All performance counters relating to XPS start with the prefix ‘XPS’.
Click Add.
To add another counter, repeat steps 5 and 6.
The added counters are displayed in the Added counters pane. You cannot add a counter more than once. When you do this, the counter displays in the Added counters pane, but displays a warning message when you click OK.
Clicking OK displays the graph as well as all the added counters at the bottom. To view the graph for a counter, select the required counter from the list at the bottom of the window.
Sample graph
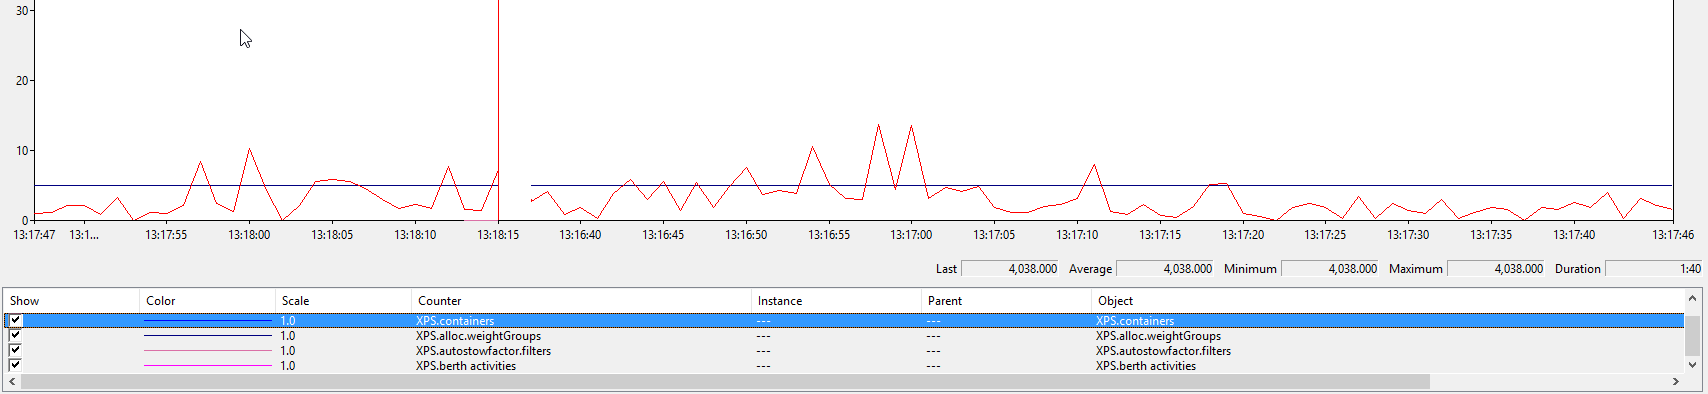
You can customize the display of each counter using the Performance Monitor Properties window.